- Purpose: Identity current customer groups
- Methods: RFM analysis, K-means, Machine Learning (Clustering)
- Results: Segmented consumers into 5 groups and found a potential risk that sales heavily relies on a few customers
- Tool: Python
NLP
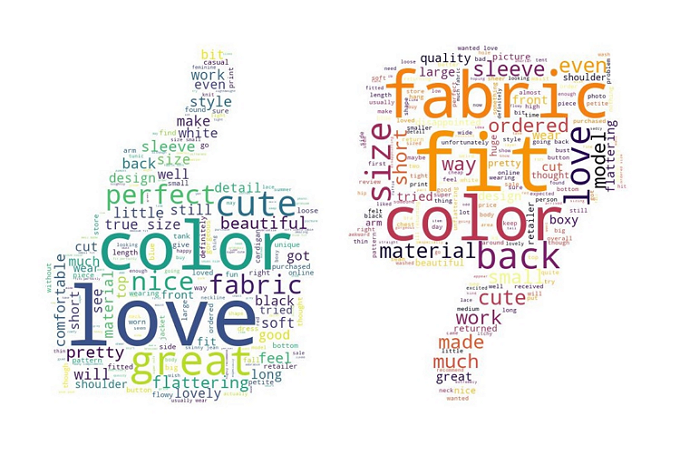
Clothing Reviews Sentiment Analysis
NLP
Semantic Similarities Takes SAT Questions
- Purpose: Constructed distributional semantic word sectors through PPMI and apply them to synonym detection and solve SAT analogy questions
- Tool: Python

NLP
Naïve Bayes Algorithm
- Purpose: Developed and implemented a multinomial Naïve Bayes classifier using bag-of-words features from scratch
- Algorithm: Naïve Bayes
- Results: Python
NLP
N-gram Language Model
- Purpose: Created unigram and bigram language models to solve the jumbled sentence task, that is, to find which sentence is a real sentence out of 10 jumbled sentences
- Results: Python

Python/R
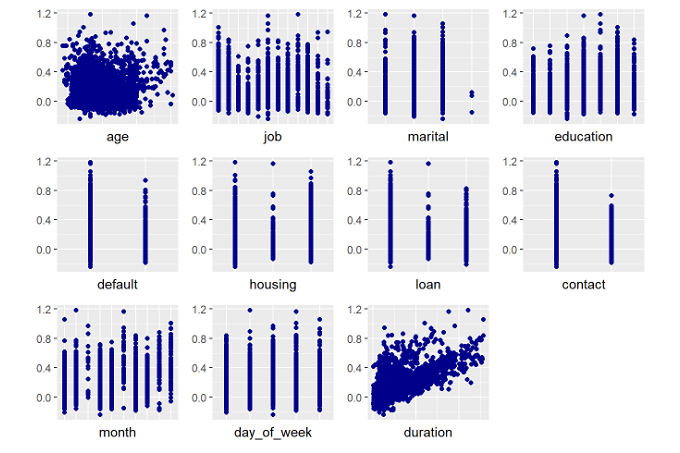
Predictive Modeling for Bank Telemarketing
-
Purpose: Find out the best times to call the right customers to promote a term deposit
-
Methods: Classification, Logistic Regression, KNN, Random Forest
-
Results: Implemented several machine learning models and selected the best performing random forest model which had the best precision score
Python/R
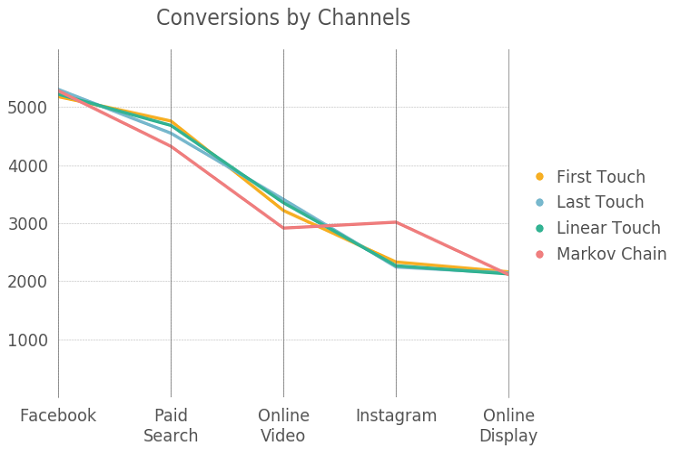
Channel Attribution Modeling
Python/R
Channel Attribution Modeling
- Purpose: Recognize channels which contributes the most sales
- Methods: Markov Chain, Visualization
- Results: In the 5 channels, Facebook and Paid Search contributes 54.4% conversions, whereas Instagram has the highest conversion rate
Python/R
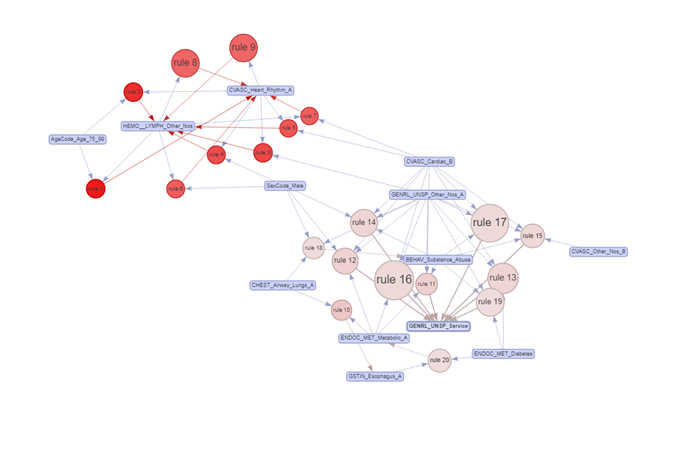
Research on COVID-19 Comorbidity
Python/R
Research on COVID-19 Comorbidity
- Purpose: Discover insights from the status quo
- Method: Descriptive Statistics, Cohort Analysis, Visualization
- Result: Strategies works very well after August and increasing the retention rate is indeed helpful to raise revenue
Python/R
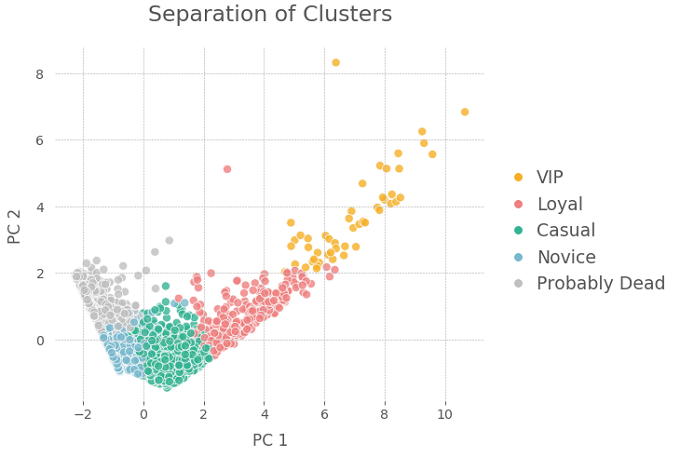
E-Commerce Customer Segmentation
Python/R
E-Commerce Customer Segmentation
- Purpose: Identity current customer groups
- Methods: RFM analysis, K-means, Machine Learning (Clustering)
- Results: Segmented consumers into 5 groups and found a potential risk that sales heavily relies on a few customers
Python/R
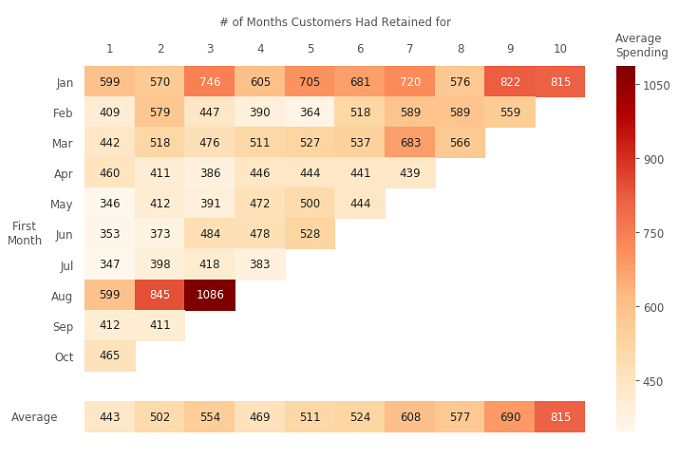
E-Commerce Exploratory Analysis
Python/R
E-Commerce Exploratory Analysis
- Purpose: Discover insights from the status quo
- Method: Descriptive Statistics, Cohort Analysis, Visualization
- Result: Strategies works very well after August and increasing the retention rate is indeed helpful to raise revenue

Python/R
Stock Market Shocks of Coronavirus
Python/R
Stock Market Shocks of Coronavirus
- Purpose: Explore how industries react to the market crash due to COVID-19
- Methods: Web Scraping, K-Median Clustering, Visualization
- Results: The energy sector suffers from a considerable decrease in the stock price, but technology, consumer products, and healthcare are relatively robust

SQL
Sales Database Buildup
- Description: Designed a schema of a database and built four tables, including customers, products, transactions and providers in order to track sales activities, relationships, and contacts
- Methods: Database Design and Management, Data Visualization
- Tools: MySQL
SQL
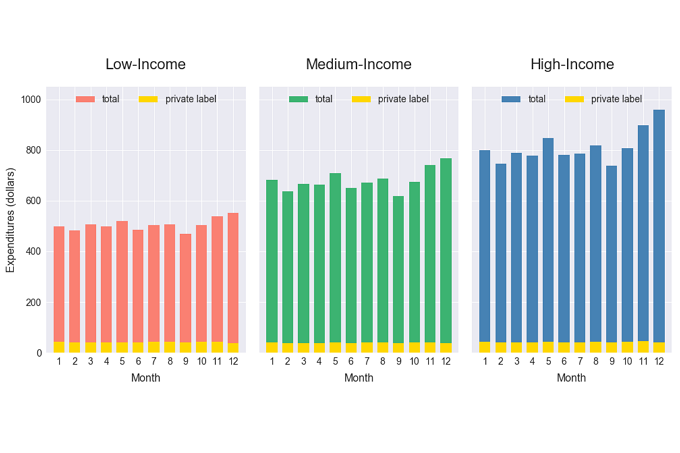
Grocery Shopping Behavior Analysis
- Description: Created a relational database with 4 tables and 50+ million observations; queried data and visualized results to explore market opportunities for private label products
- Methods: Database Design, Query and Management, Data Visualization
- Tools: MySQL, Python Matplotlib
Viz
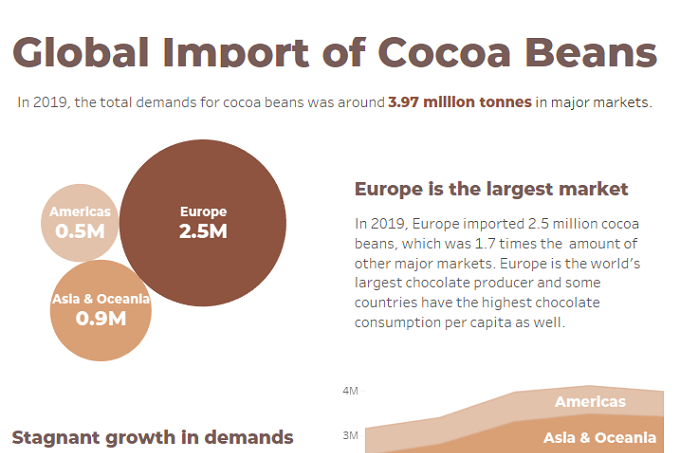
Global Import of Cocoa Beans
- Graphs: Bubble Chart, Area Chart, Bar Chart
- Tools: Tableau
Viz
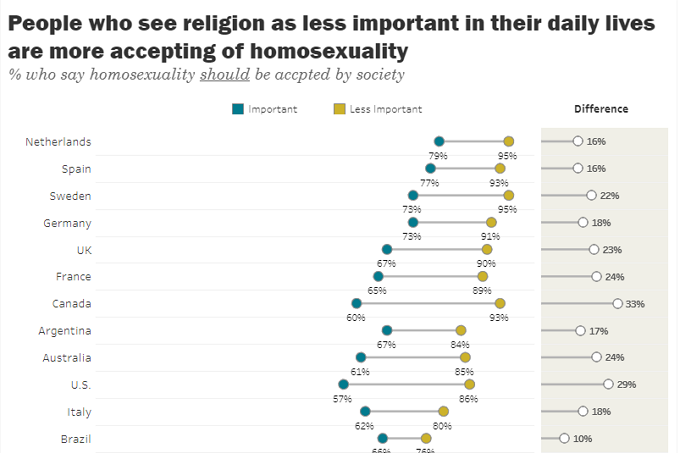
The Global Divide on Homosexuality
- Graphs: Dumbbell Chart, Lollipop Chart
- Tools: Tableau
Viz
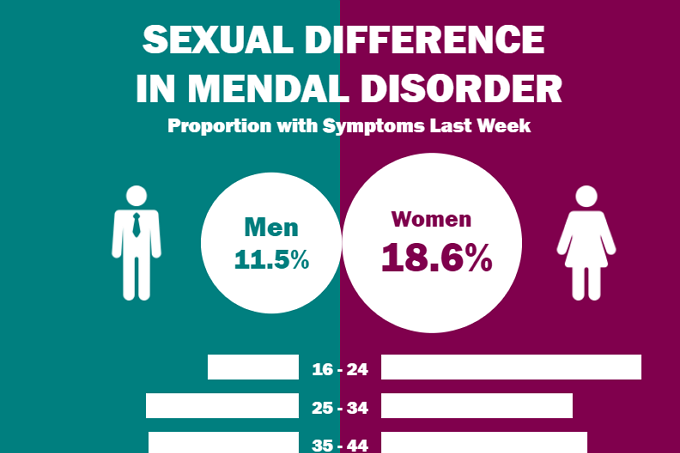
Sexual Difference in Mental Disorder
- Graphs: Bubble Chart, Butterfly Chart
- Tools: Tableau
Viz
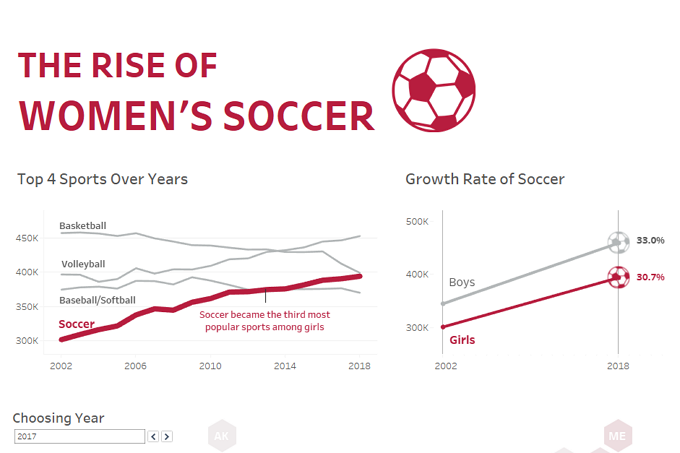
The Rise of Women Soccer
- Graphs: Dashboard, Time Series Plot, Hexagon Map, Bar Chart, Scatter Plot
- Tools: Tableau
Web App
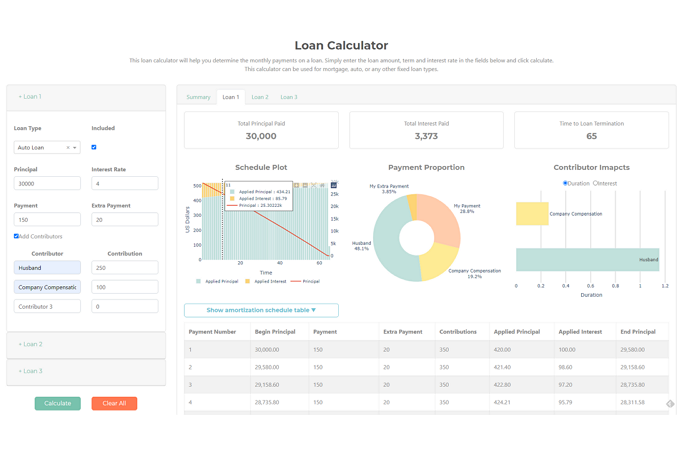
Loan Analytics Calculator and Dashboard
- Purpose: A web application to calculate monthly payment for multiple loans in tables and charts Methods: Data Visualization, Web Application Tools: Python, Plotly Dash
Web App
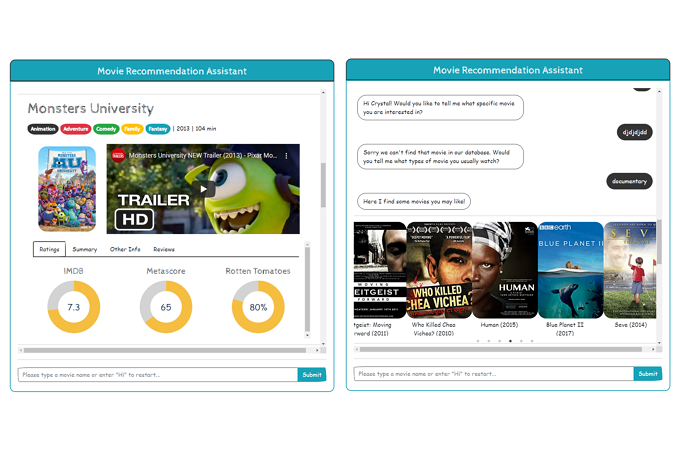
Virtual Movie Recommendation Assistant
- Purpose: A chatbot to help users find the movie of interest, and provide recommendations based on the chosen movie
- Methods: Web Scraping, Finite State Machine, Recommender System, Web Application
- Tools: Python, Plotly Dash
Photo by Possessed Photography on Unsplash
Web App
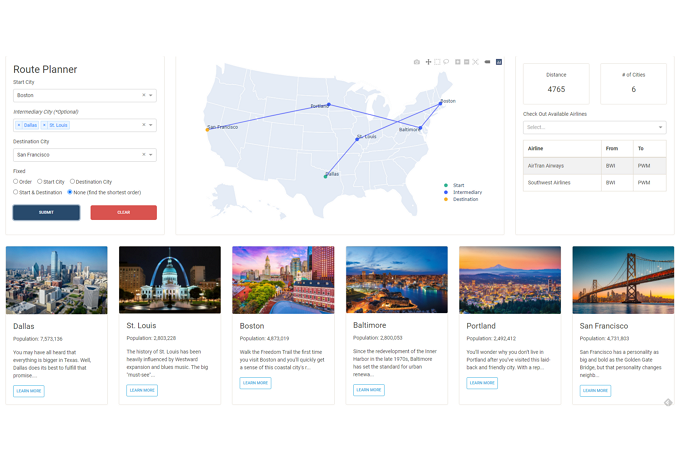
Route Planner and Network Analysis
- Purpose: A web application to optimize travel routes and offer information about cities along the route
- Methods: Network Analysis, Data Visualization, Web Application
- Results: Python, Plotly Dash